Tri-Bridges Chess Club · November 12, 2026

Facebook ads, explained.

Five annotated reports for a clear conversation about what the active campaigns are spending, who they are reaching, and what interest they are generating.

2 active campaigns5 annotated reportsMonth-to-date snapshots

REPORT 01

Active Campaigns - Overview Table

Start with the two active campaigns side by side: spending, results, cost per result and audience exposure.
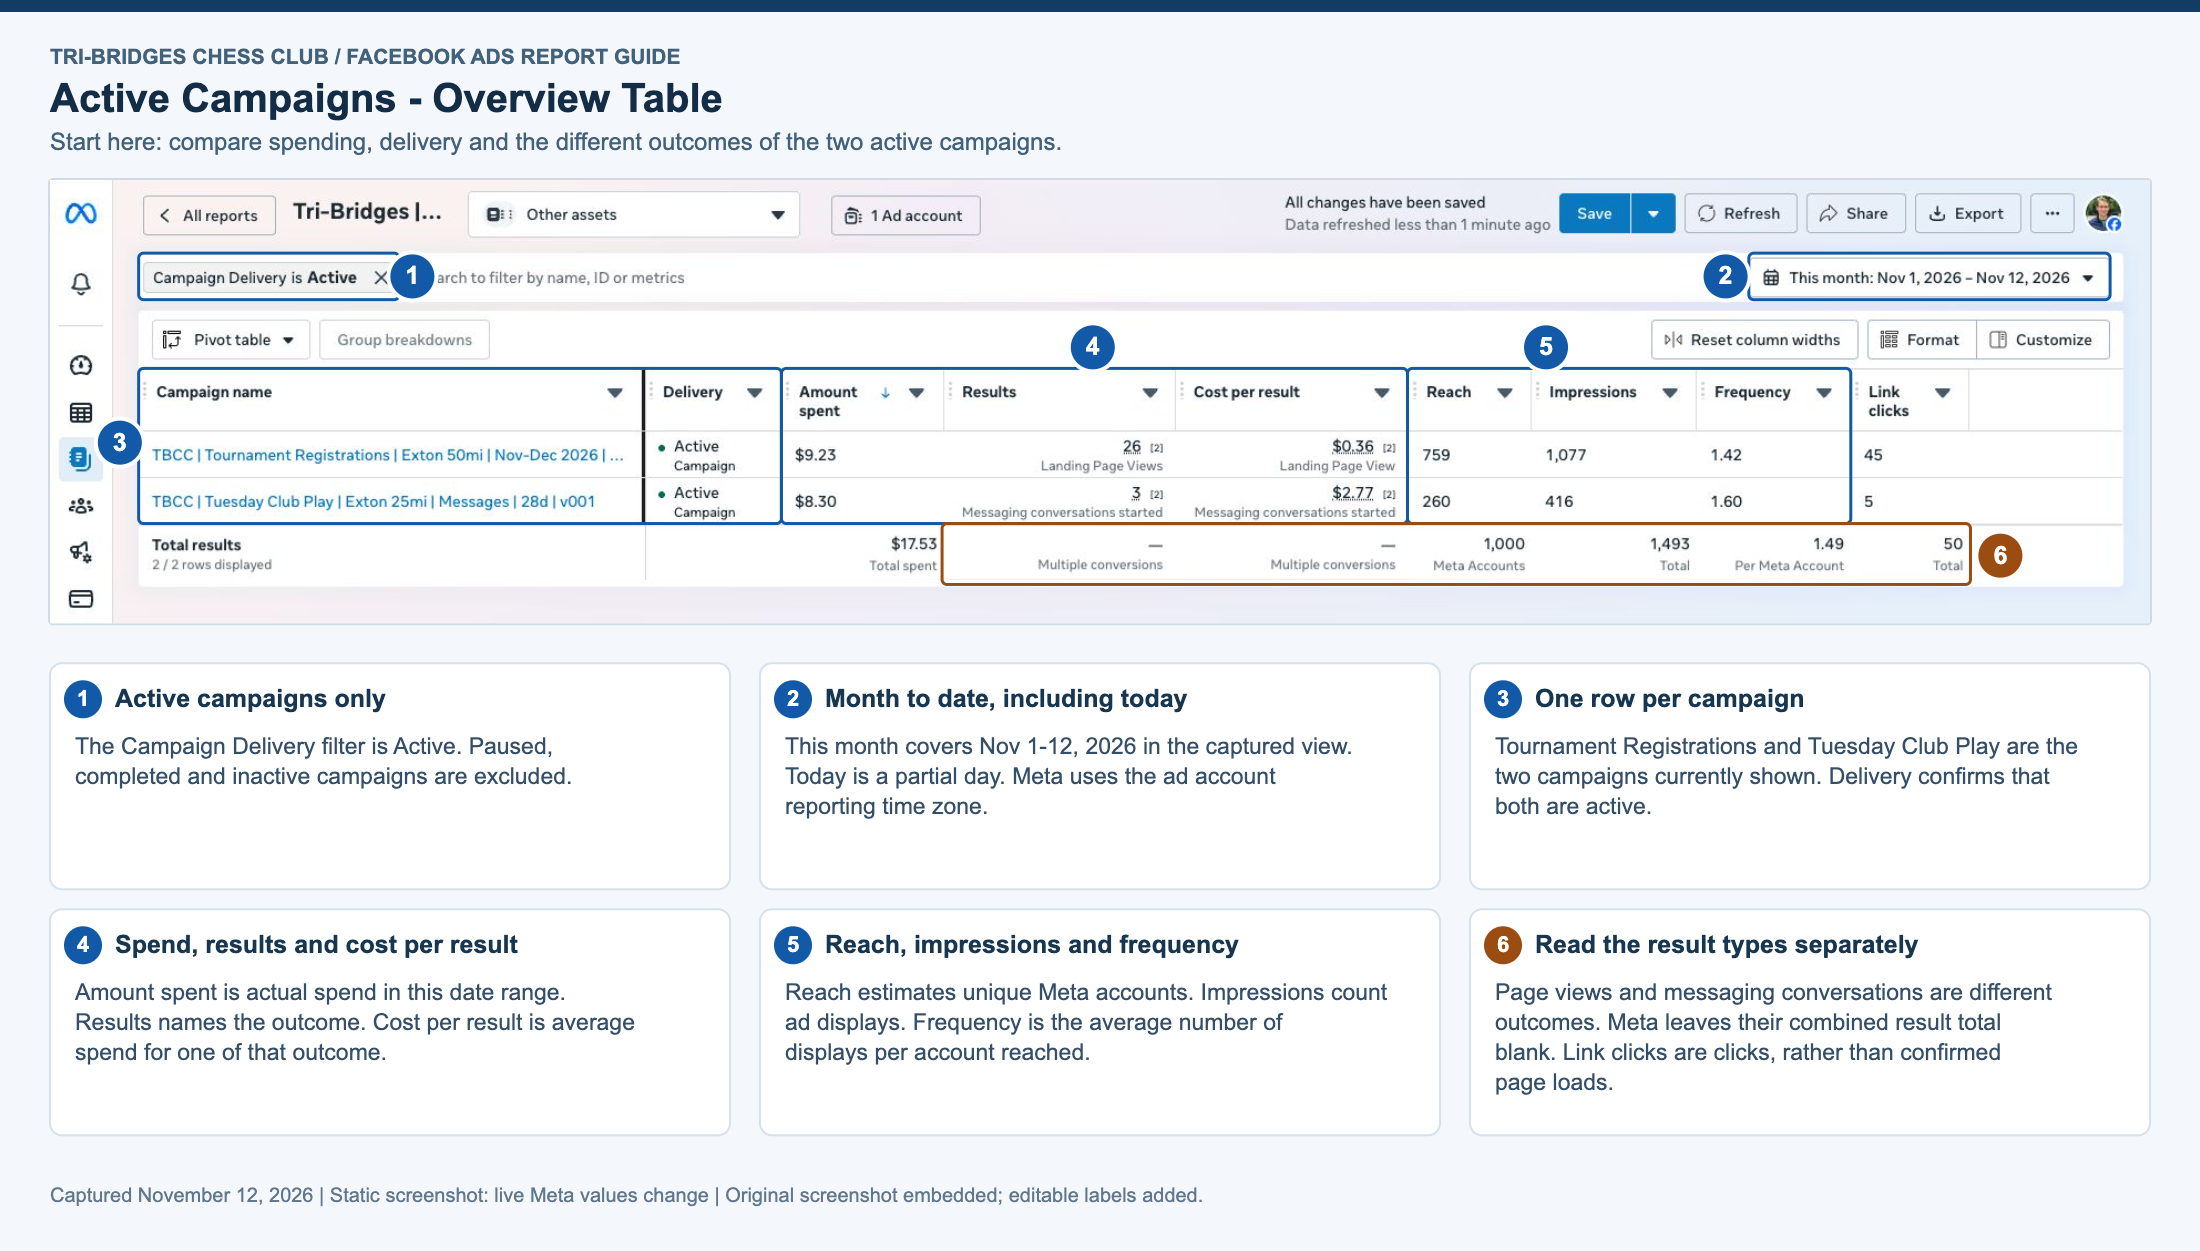
Annotated screenshot of Active Campaigns - Overview Table, with six numbered explanations for the filters, date range, metrics and interpretation.

REPORT 02

Tuesday Club Play - Results Table

The exact numbers for the Tuesday club-play messaging campaign, including conversations and new contacts.
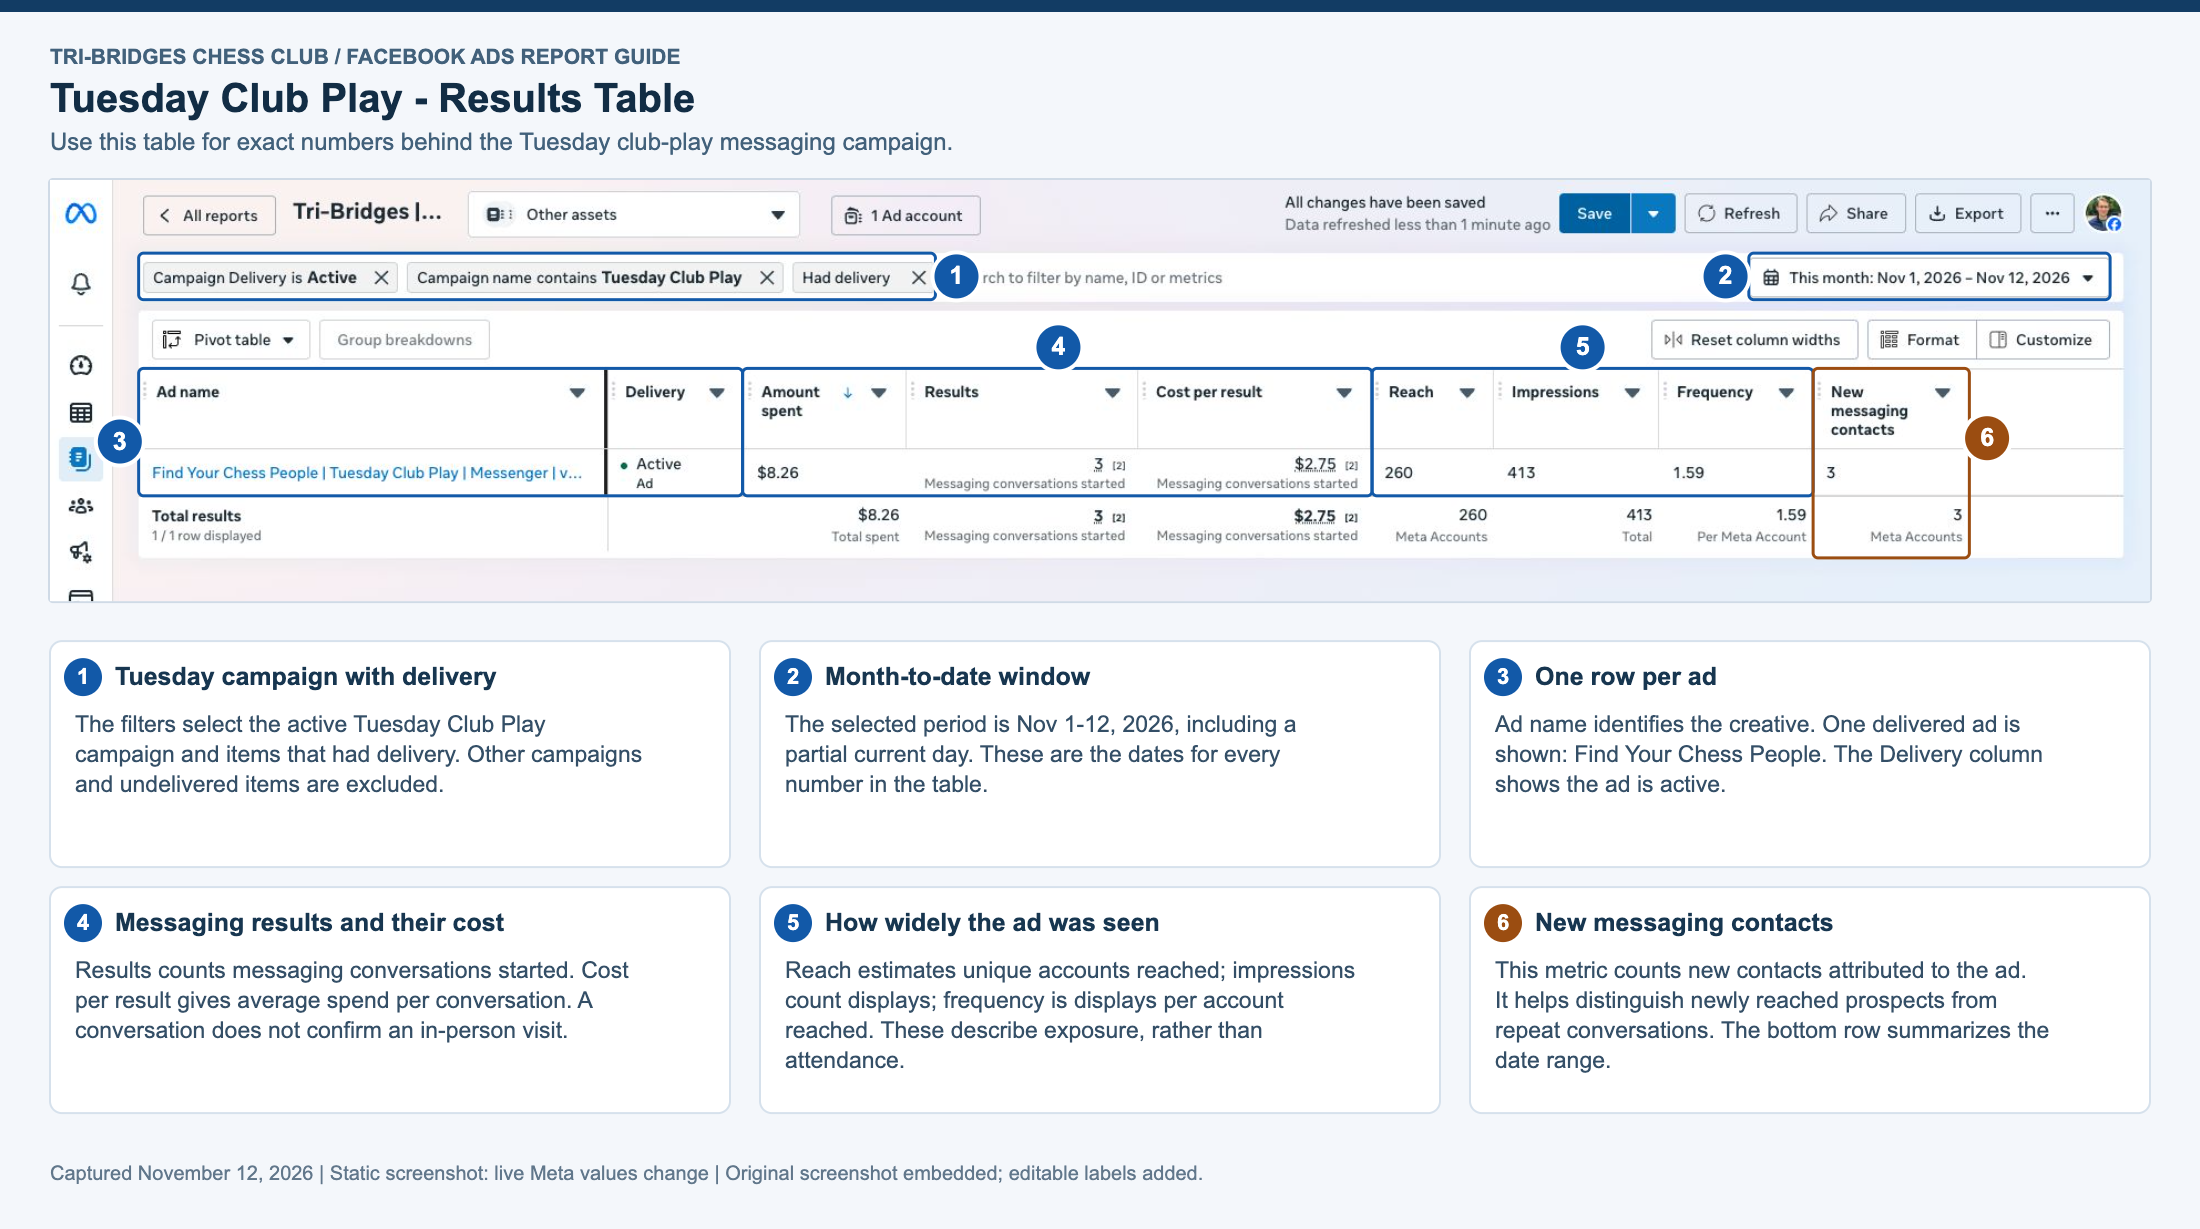
Annotated screenshot of Tuesday Club Play - Results Table, with six numbered explanations for the filters, date range, metrics and interpretation.

REPORT 03

Tuesday Club Play - Charts

Daily spending and messaging conversations, shown on separate charts.
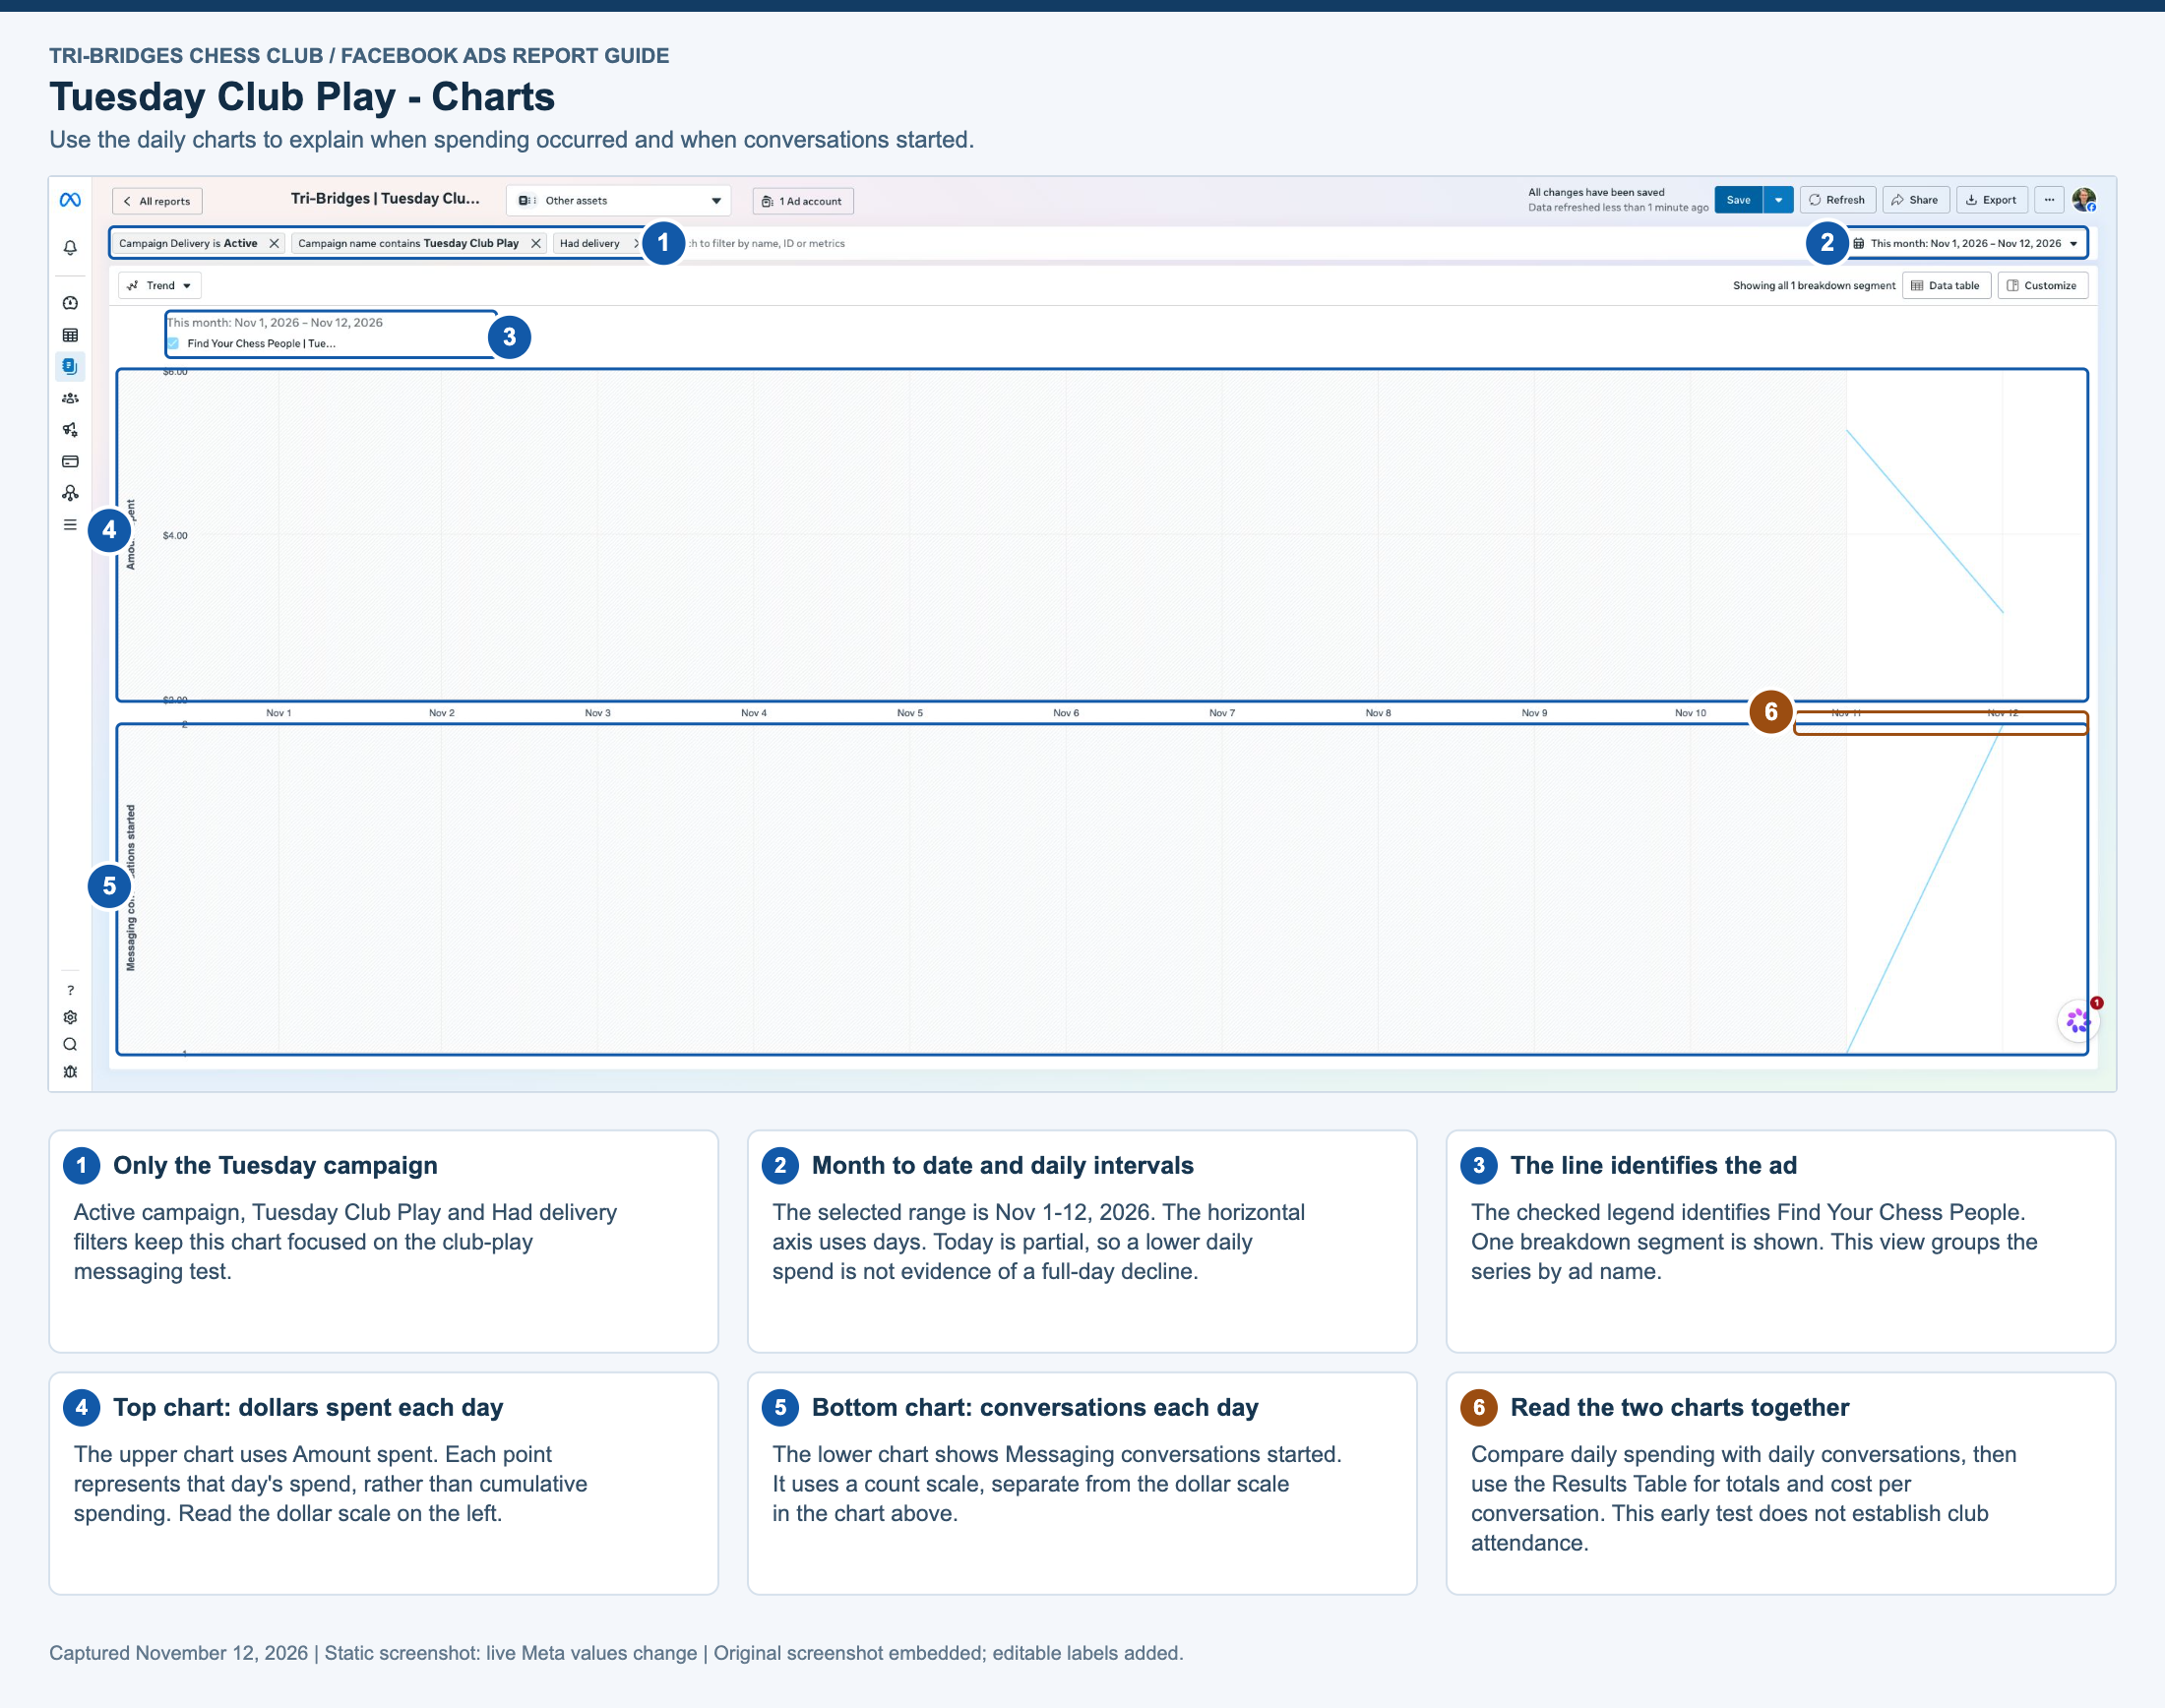
Annotated screenshot of Tuesday Club Play - Charts, with six numbered explanations for the filters, date range, metrics and interpretation.

REPORT 04

Tournament Ads - Results Table

Performance by tournament event: page visits, spending, cost per visit and click efficiency.
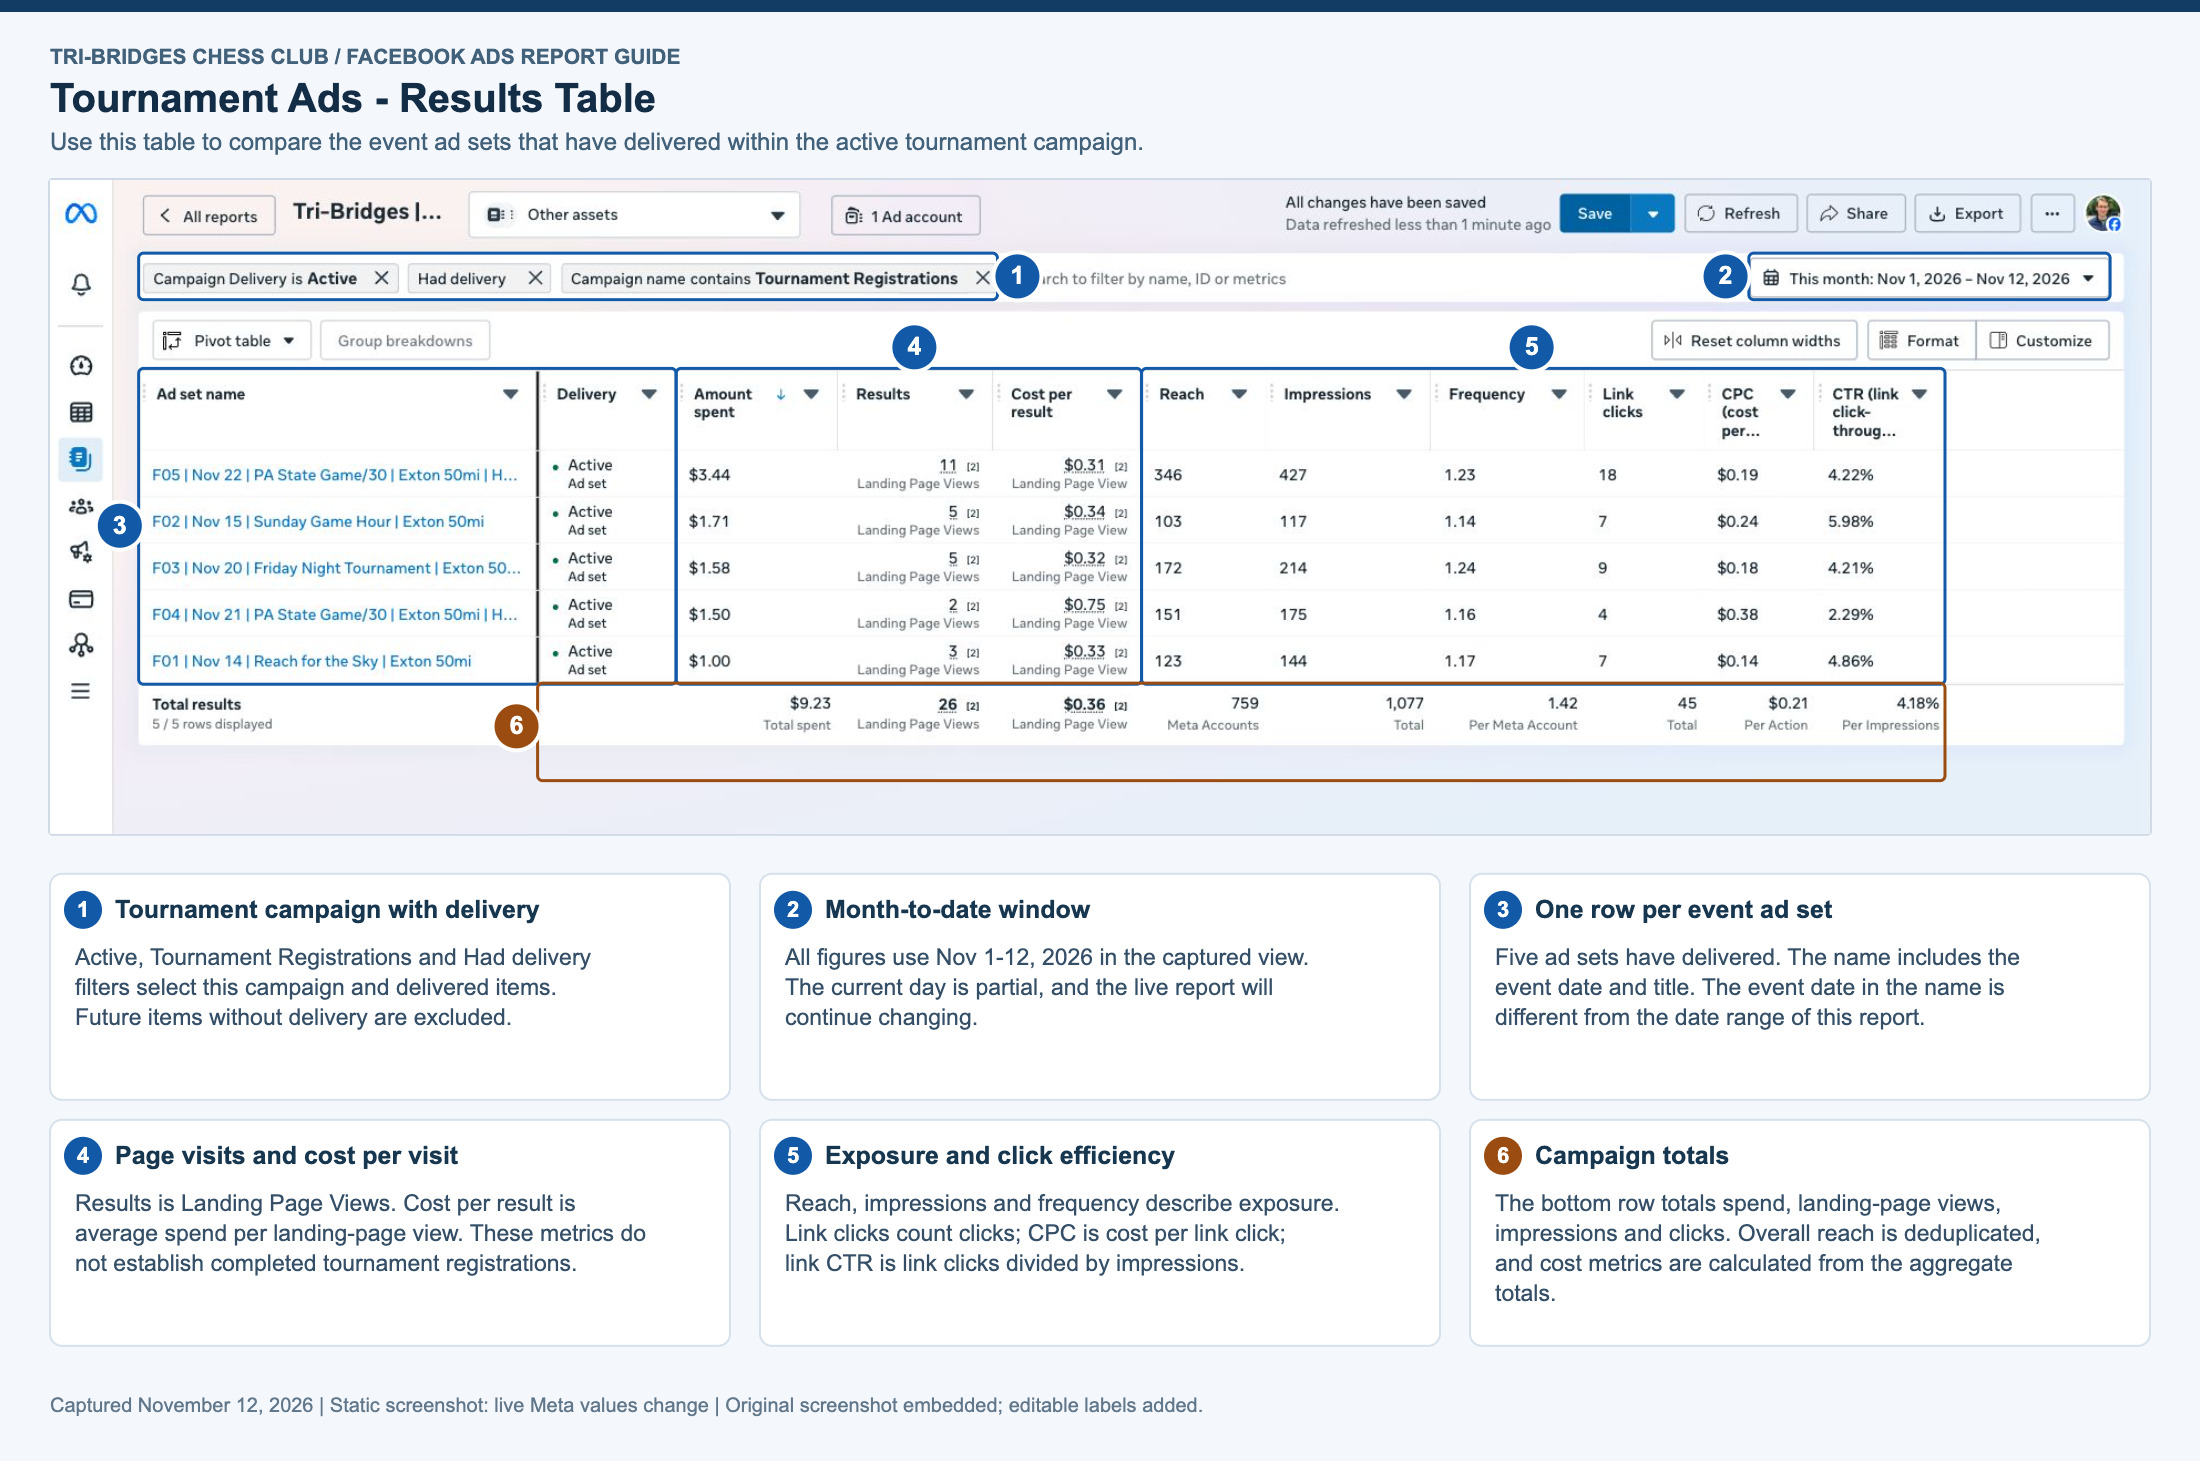
Annotated screenshot of Tournament Ads - Results Table, with six numbered explanations for the filters, date range, metrics and interpretation.

REPORT 05

Tournament Ads - Charts

A visual comparison of landing-page views across the promoted events.
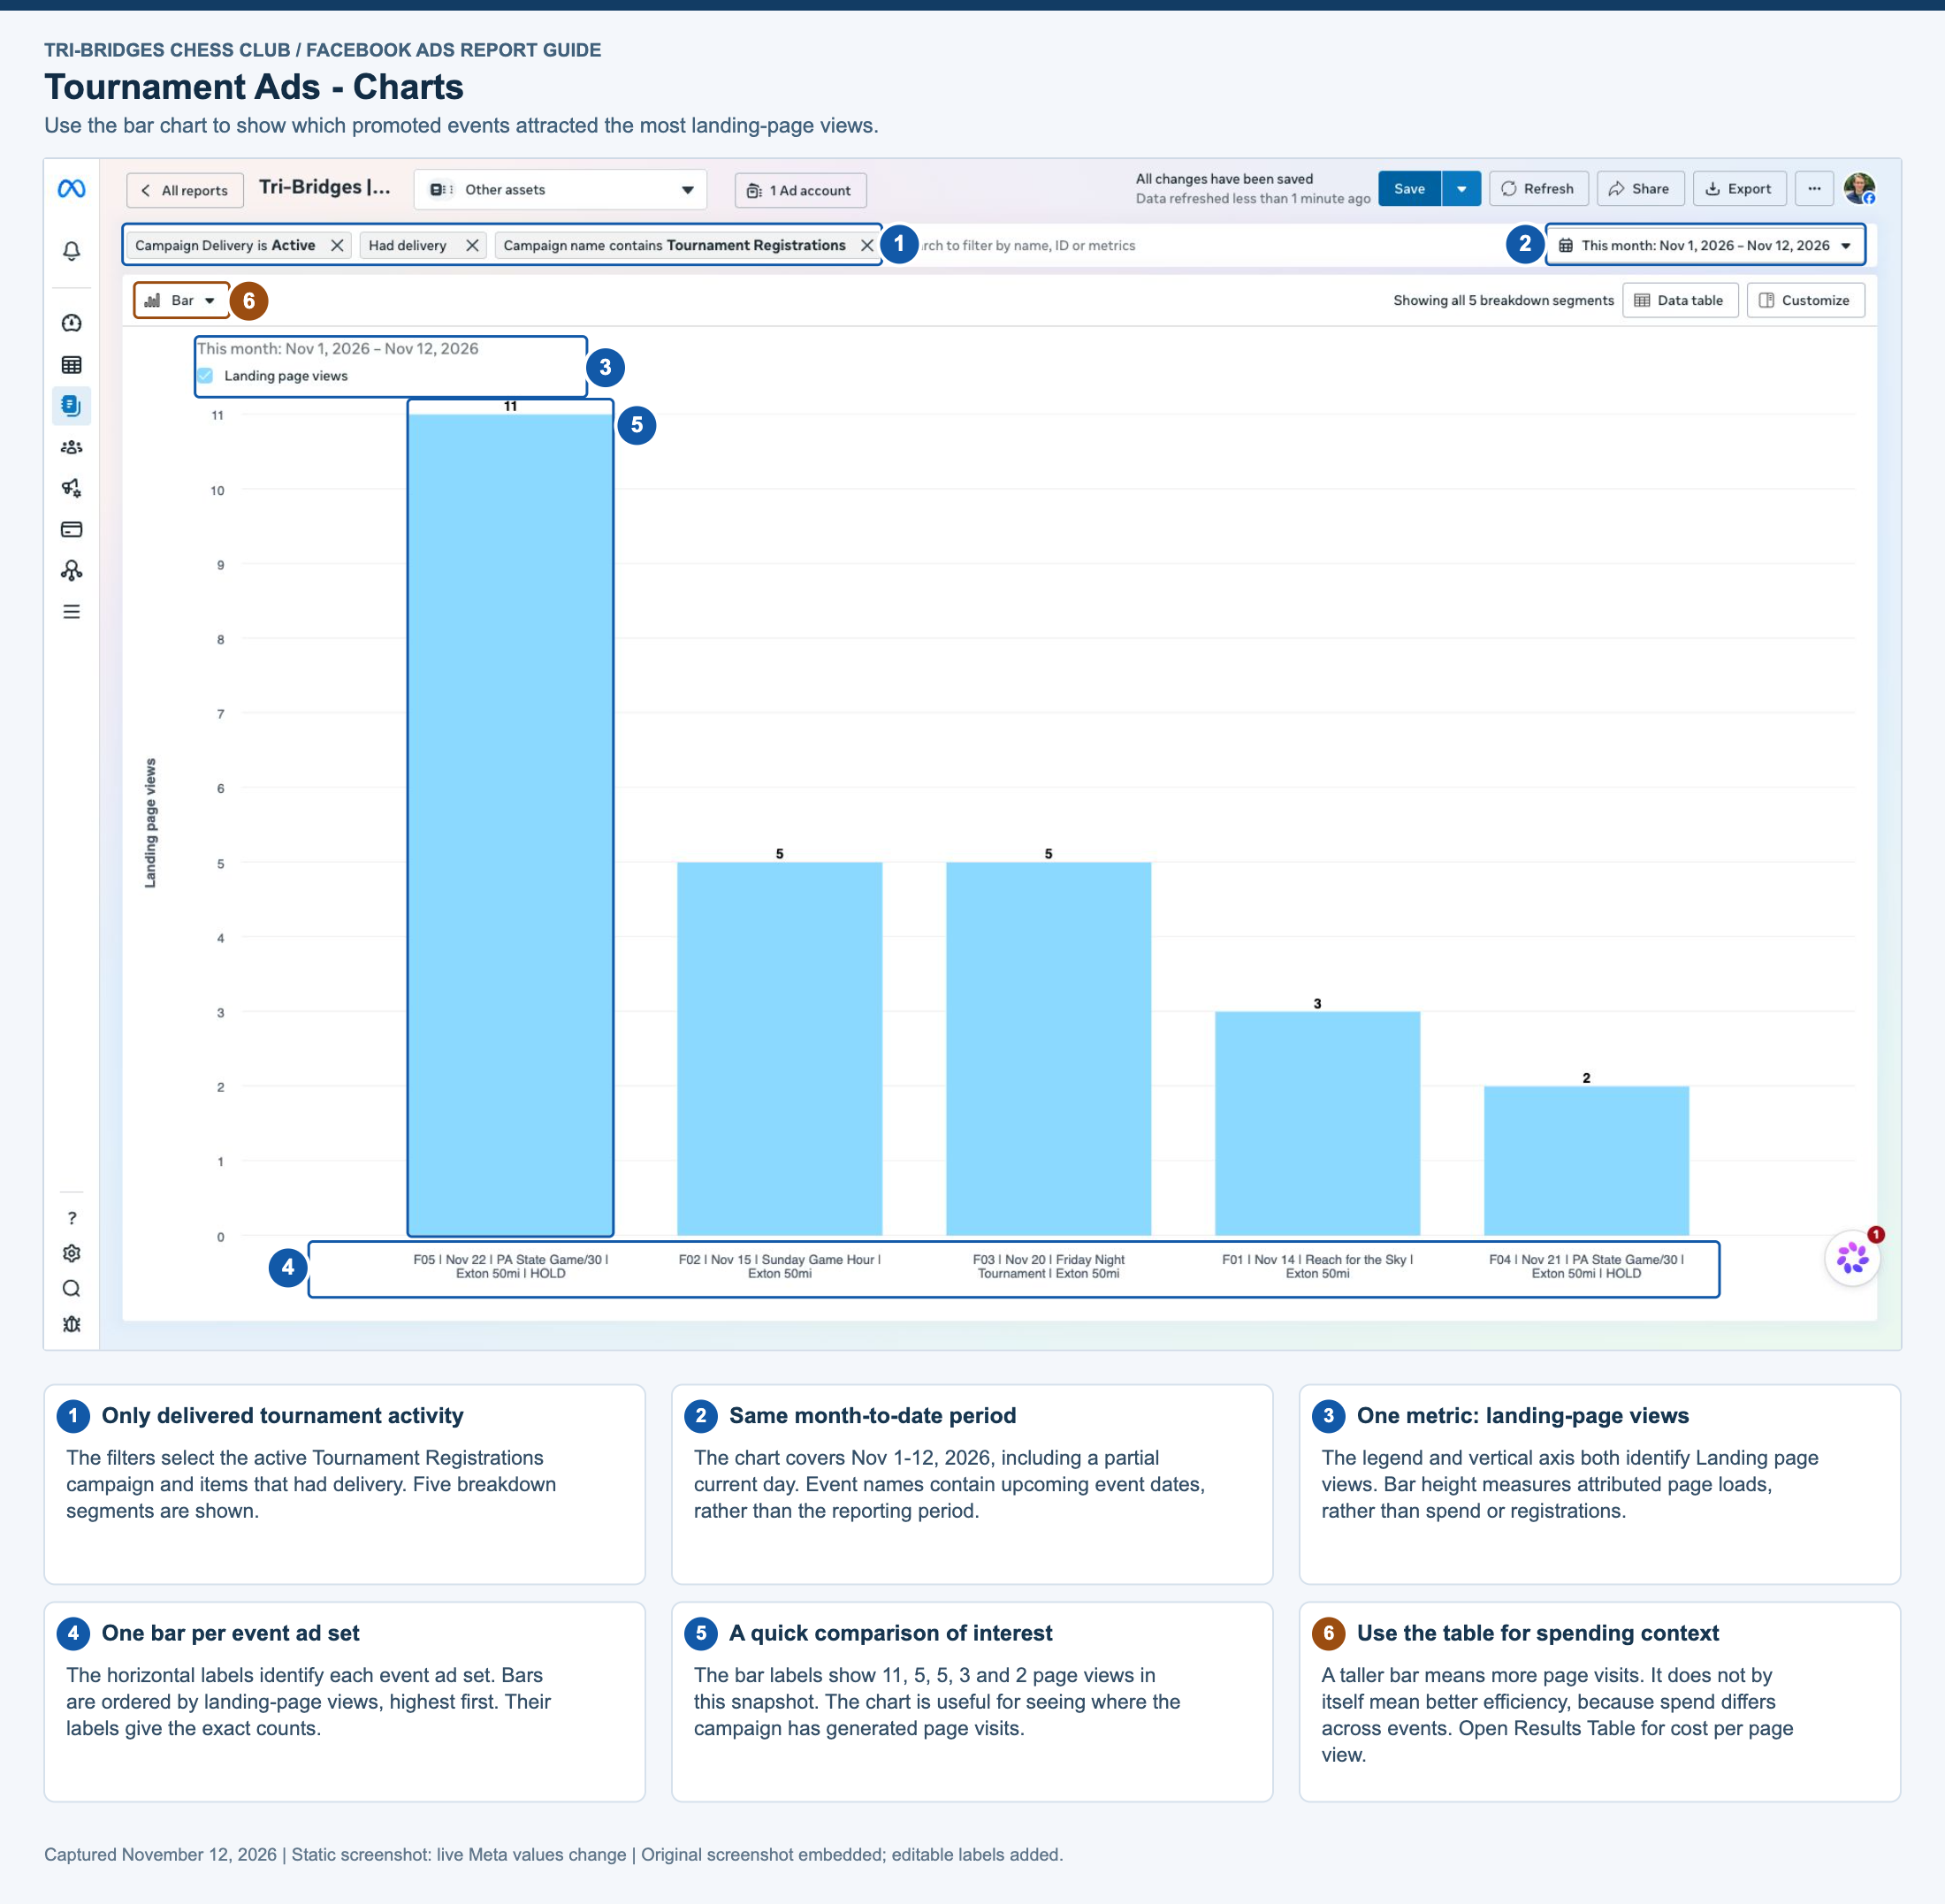
Annotated screenshot of Tournament Ads - Charts, with six numbered explanations for the filters, date range, metrics and interpretation.
Download all five annotated images

Conversations and page visits help show interest. Completed tournament registrations and in-person club attendance still need their own confirmation.